We Are So Screwed
Earlier this week, Bondad, Daily Kos's resident economic analyst suggested that there is a Black Swan myth. That's to say that the economy is starting to get better, and that there aren't any potentially catastrophic combinations of economic events on the horizon.
The idea of the Black Swan isn't that events are entirely unforseeable, only that they do not agree with what we think to be true of the world. Because much of what we assume to be economic "truth" occurs operates at a high level of abstraction, linkages that are invisible when we look down on high are missed. And these linkages, like a web, create the possibility for a small event to cascade into something far larger, and more harmful. It often is not any one thing, but the combination of many that creates true crisis. I will get to this, but first let's not fool ourselves into thinking that it's morning in America just yet.
Background
First, the claim that things are starting to improve on the employment front is far more complex than hunky dory picture painted by putting up this graph:
The good news is that last week seasonally adjusted initial claims for unemployment were dropping:
In the week ending July 11, the advance figure for seasonally adjusted initial claims was 522,000, a decrease of 47,000 from the previous week's revised figure of 569,000. The 4-week moving average was 584,500, a decrease of 22,500 from the previous week's revised average of 607,000.
These are the numbers used to produce the graph above. What's not mentioned is that this set of numbers is produced through the manipulation of the actual numbers to conform to a statistical model that attempts to remove seasonal variance to make numbers comparable across seasons. Strip that statistical model away and the numbers tell a far different story.
The advance number of actual initial claims under state programs, unadjusted, totaled 667,534 in the week ending July 11, an increase of 86,389 from the previous week. There were 483,981 initial claims in the comparable week in 2008.
Say again what. The numbers fell, but they actually rose? So which one is right. The hard answer is that they both are supposed to be, but they clearly aren't. Why?
Because the expectations ingrained in the model are wrong. It's a baby black swan. Or more to the point it's a lot of people with a lot of education being incredibly ignorant. What am I talking about?
The seasonal adjusting model operates from the known past, and assumes that there will be summer layoffs for retooling in the auto industry at this time of year. This means that it deflates the actual number of adjusted claims to match what "should" be happening at this time of year. That didn't happen this year. The auto layoffs came early because GM and Chrysler shut down while they went through bankruptcy proceedings. Now that GM is out of court, they've called the guys and gals back in the last week. This has really fucked with the models used to create seasonally adjusted numbers.
The number of Americans filing claims for unemployment benefits fell last week to the lowest level since January, depressed by shifts in the timing of auto plant shutdowns.
Initial jobless claims dropped by 47,000 to 522,000, lower than forecast, in the week ended July 11, from a revised 569,000 the prior week, the Labor Department said today in Washington. The number of people collecting unemployment insurance plunged by a record 642,000, also reflecting seasonal issues surrounding the closures at carmakers.
A Labor analyst said the distortions may play havoc with claims data for another couple of weeks. General Motors Co. and Chrysler Group LLC accelerated shutdowns this year heading into bankruptcy, months before the traditional July closings. Through the gyrations, job losses may subside amid signs the housing and manufacturing slumps are easing.
The distortion started in April and May when large numbers of autoworkers were put on layoff at a time when the model said that plants should be going full bore. It helps to look at the seasonally adjusted and unadjusted numbers from the start of the year to now to get an idea of how this wreaks havoc on the seasonally adjusted reported numbers. As I suggested to New Deal Democrat in Bondad's diary, it's likely that the seasonal adjustment of numbers is obscuring an underlying trend.
I suggested that it would look something like this (blue is seasonally adjusted, red is actual):
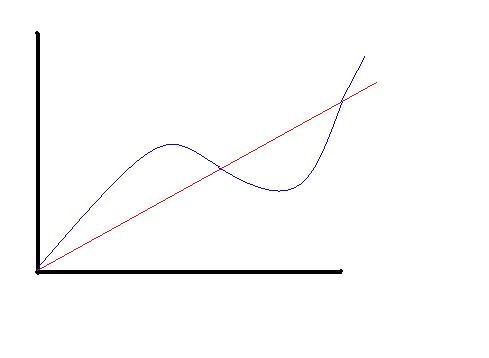
If we mock up the seasonally adjusted and real numbers since the start of the year we get this:
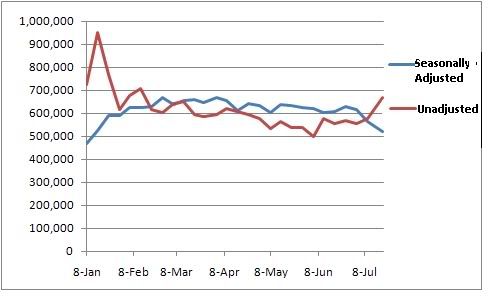
Again, there are two different stories, if you want a happy ending you use the blue, seasonally adjusted line. If you want to be more honest about what's happening you use the red line, and you see that unemployment is actually on the rise after having settled down. And worse, this whole measure may not be adequately capturing unemployment. The numbers for initial claims only cover people who are collecting unemployment insurance, but the unemployment rate that we hear about all the time (U-3) includes a much broader group of people
Yesterday the new unemployment statistics came out from the BLS.
And, the numbers are ugly, 15 states and DC have unemployment rates over 10%, and another 6 are over 9%.

So again, we have competing versions of the truth being presented to us statistically. The seasonally adjusted initial claims suggest that the unemployment situation is improving. The new U-3 ("unemployment) figure suggests that things are still declining. Why the difference?
At least part of the story is that only a portion of the currently unemployed are covered by unemployment insurance. The percentage covered is scandalously low in some areas. For example in Washington, DC only 15% of the unemployed are receiving unemployment benefits. In Pennsylvania, on the other hand, that number is 77%. I've laid this out across the nation on the map below.
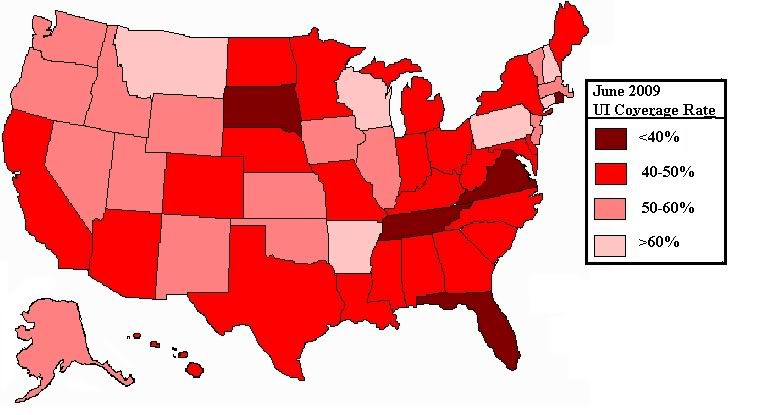
Throughout most of the country, the initial claims figure covers less than half of the unemployed. It only gives half the story, literally, and as the recession drags on people are increasingly using up all their unemployment benefits, and still without a job. By the end of the year something like 100,000 people will be in this position if current trends continue.
All the things I've brought up suggest that we should be suspicious of the initial claims number as a measure of unemployment, and that things are still pretty bad out there. It's a problem because these models create expectations, and when those expectations are wrong, the response when the truth comes out is shock and awe. Things go awry, and have an outsized impact, lowering consumer confidence and further hurting the economy. And on top of all this, two very big black swans are getting ready to kiss.
Black Swans on the Horizon
Something like 70% of our economy is based in consumer spending. One of the things that keeps this running smoothly is a process called factoring.
Basically factoring works like this. Let's say that I am a shoe store. I buy shoes from the factory and sell them to customers. When I buy shoes I have a period of time (let's say 60-90 days) to pay shoe factory.
If you are the shoe factory, you don't really want to wait 60-90 days for payment. But you have an option, rather than waiting 60-90 days for me to give you cash, you can sell that obligation to a third party. So you get cash from the factoring company, and I pay that factoring company the money instead of you. You are going to get less than the full amount of money that I owe you, but you are going to get that money now. This means you can buy supplies to buy more shoes now with money in hand instead of having to take out a loan. This is the factoring process.
This is what CIT Group does for thousands of small retailers, including franchisees (like Dunkin' Donuts). CIT Group has a serious problem, they are on the verge of bankruptcy.
What would this mean?
In an environment where there is little credit available to retailers, it would mean that they would be unable to get product into stores. So basically empty shelves, potentially into the holiday season. And, of course empty shelves will mean that many businesses will be forced to close. That means more people out of work in the retail industry.
It doesn't end there. The problem is that if companies have to go back to waiting 60-90 days for payment, they have to cut production. And that means that the people who make shoes, and the like, are out of work also.
In the apparel , something like 60% of the industry depends on CIT for factoring. That could lead to huge disruptions if they go bankrupt.
CIT going bankrupt could mean that thousands of retail shops, distributors, and apparel factories could go out of business. It's the same story in many other sectors. This alone could cause a great loss of jobs.
But, it's worse than that. Any sort of retail collapse is going to mean that lots of commercial real estate suddenly becomes vacant.
This comes at a time when the commercial real estate market is extremely shaky.
The $3.5 trillion commercial real estate market is a ticking “time bomb” that may lead to a second wave of losses at large U.S. banks, congressional Joint Economic Committee Chairwoman Carolyn Maloney said.....
There were 5,315 commercial properties in default, foreclosure or bankruptcy at the end of June, more than twice the number at the end of last year, with hotels and retail among the most “problematic,’ Real Capital Analytics Inc. said in a report yesterday. Losses on commercial mortgage-backed securities, or CMBS, will total 9 percent to 12 percent of the market, or as much as $90 billion, said Richard Parkus, a research analyst for Deutsche Bank Securities in New York.
And it's worse than that. Remember that through the magic of Credit Default Swaps (CDS), a $90 Billion nominal loss may lead to an amount 10-20 times that being lost in derivatives markets. Which means the exposure for banks could be huge. And it's not just any banks that are in danger here:
A disproportionately high number of small and medium-sized banks have “sizable exposure” to commercial real estate loans, and delinquency rates at around 7 percent in the first quarter are almost double from a year ago, he said.
In other words if there has to be a rescue, we are likely going to see large banks based in New York swallowing up local and regional banks across the country at fire sale prices. And the concentration of financial power in this country will continue apace.
It's not the CIT situation or commercial real estate alone that can do the real damage, but together the situation is made worse.
A CIT bankruptcy could lead to spiraling retail closures, creating large numbers of distressed commercial properties. Banks would have to hold on even tighter to cash to stay solvent in this environment, meaning less money lent. Less money lent means retail and production companies have less ability to ride out the recession through deficit financing. Which means even more commercial real estate goes vacant. And so on, and so on, until a horrible amount of damage has been done.
This has the smell of a real Black Swan, and it comes at a time when people (falsely) believe that things are finally improving.
No comments:
Post a Comment